Zoomed inset in matplotlib without re-plotting data
问题内容:
I’m working on some matplotlib plots and need to have a zoomed inset. This is
possible with the zoomed_inset_axes from the axes_grid1 toolkit. See the
example
here:
import matplotlib.pyplot as plt

from mpl_toolkits.axes_grid1.inset_locator import zoomed_inset_axes
from mpl_toolkits.axes_grid1.inset_locator import mark_inset

import numpy as np

def get_demo_image():
    from matplotlib.cbook import get_sample_data
    import numpy as np
    f = get_sample_data("axes_grid/bivariate_normal.npy", asfileobj=False)
    z = np.load(f)
    # z is a numpy array of 15x15
    return z, (-3,4,-4,3)

fig, ax = plt.subplots(figsize=[5,4])

# prepare the demo image
Z, extent = get_demo_image()
Z2 = np.zeros([150, 150], dtype="d")
ny, nx = Z.shape
Z2[30:30+ny, 30:30+nx] = Z

# extent = [-3, 4, -4, 3]
ax.imshow(Z2, extent=extent, interpolation="nearest",
          origin="lower")

axins = zoomed_inset_axes(ax, 6, loc=1) # zoom = 6
axins.imshow(Z2, extent=extent, interpolation="nearest",
             origin="lower")

# sub region of the original image
x1, x2, y1, y2 = -1.5, -0.9, -2.5, -1.9
axins.set_xlim(x1, x2)
axins.set_ylim(y1, y2)

plt.xticks(visible=False)
plt.yticks(visible=False)

# draw a bbox of the region of the inset axes in the parent axes and
# connecting lines between the bbox and the inset axes area
mark_inset(ax, axins, loc1=2, loc2=4, fc="none", ec="0.5")

plt.draw()
plt.show()
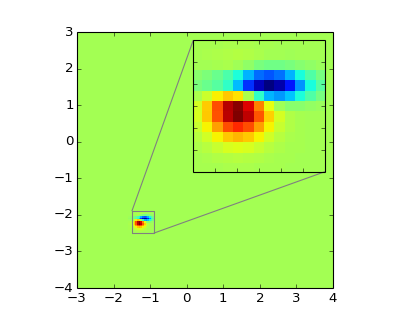
This will give the desired result:
 http://matplotlib.org/1.3.1/_images/inset_locator_demo21.png
But as you can see in the code, the data has to be plotted twice - once for
the main axis (ax.imshow...) and once for the inset axis
(axins.imshow...).
My question is:
Is there a way to add a zoomed inset after the main plot is completed,
without the need to plot everything again on the new axis?
Please note: I am not looking for a solution which wraps the plot call with a
function and let the function plot ax and axins (see example below), but
(if this exists) a native solution that makes use of the existing data in
ax. Anybody knows if such a solution exists?
This is the wrapper-solution:
def plot_with_zoom(*args, **kwargs):
    ax.imshow(*args, **kwargs)
    axins.imshow(*args, **kwargs)
It works, but it feels a bit like a hack, since why should I need to plot all
data again if I just want to zoom into a region of my existing plot.
Some additional clarification after the answer by ed-smith:
The example above is of course only the minimal example. There could be many
different sets of data in the plot (and with sets of data I mean things
plotted via imshow or plot etc). Imagine for example a scatter plot with
10 arrays of points, all plotted vs. common x.
As I wrote above, the most direct way to do that is just have a wrapper to
plot the data in all instances. But what I’m looking for is a way (if it
exists) to start with the final ax object (not the individual plotting
commands) and somehow create the zoomed inset.
问题答案:
I think the following does what you want. Note that you use the returned
handle to the first imshow and add it to the axis for the insert. You need
to make a copy so you have a separate handle for each figure,
import matplotlib.pyplot as plt

from mpl_toolkits.axes_grid1.inset_locator import zoomed_inset_axes
from mpl_toolkits.axes_grid1.inset_locator import mark_inset

import numpy as np
import copy

def get_demo_image():
    from matplotlib.cbook import get_sample_data
    import numpy as np
    f = get_sample_data("axes_grid/bivariate_normal.npy", asfileobj=False)
    z = np.load(f)
    # z is a numpy array of 15x15
    return z, (-3,4,-4,3)

fig, ax = plt.subplots(figsize=[5,4])

# prepare the demo image
Z, extent = get_demo_image()
Z2 = np.zeros([150, 150], dtype="d")
ny, nx = Z.shape
Z2[30:30+ny, 30:30+nx] = Z

# extent = [-3, 4, -4, 3]
im = ax.imshow(Z2, extent=extent, interpolation="nearest",
          origin="lower")

#Without copy, image is shown in insert only
imcopy = copy.copy(im)
axins = zoomed_inset_axes(ax, 6, loc=1) # zoom = 6
axins.add_artist(imcopy)

# sub region of the original image
x1, x2, y1, y2 = -1.5, -0.9, -2.5, -1.9
axins.set_xlim(x1, x2)
axins.set_ylim(y1, y2)

plt.xticks(visible=False)
plt.yticks(visible=False)

# draw a bbox of the region of the inset axes in the parent axes and
# connecting lines between the bbox and the inset axes area
mark_inset(ax, axins, loc1=2, loc2=4, fc="none", ec="0.5")

plt.draw()
plt.show()
For your wrapper function, this would be something like,
def plot_with_zoom(*args, **kwargs):
    im = ax.imshow(*args, **kwargs)
    imcopy = copy.copy(im)
    axins.add_artist(imcopy)
However, as imshow just displays the data stored in array Z as an image, I
would think this solution would actually be slower than two separate calls to
imshow. For plots which take more time, e.g. a contour plot or
pcolormesh, this approach may be sensible…
EDIT:
Beyond a single imshow, and for multiple plots of different types. Plotting
functions all return different handles (e.g. plot returns a list of lines,
imshow returns a matplotlib.image.AxesImage, etc). You could keep adding these
handles to a list (or dict) as you plot (or use a
collection if they are
similar enough). Then you could write a general function which adds them to an
axis using add_artist or add_patch methods from the zoomed axis, probably with
if type checking to deal with the various types used in the plot. A simpler
method may be to loop over ax.get_children() and reuse anything which isn’t
an element of the axis itself.
Another option may be to look into blitting techniques,
rasterization
or other techniques used to speed up animation, for example using
fig.canvas.copy_from_bbox or fig.canvas.tostring_rgb to copy the entire
figure as an image (see why is plotting with Matplotlib so
slow?low). You could also draw the figure, save it to a non-
vector graphic (with savefig or to a StringIO
buffer), read back in and plot a zoomed
in version.
